Welcome to GDAC
An official website of the State of Georgia.
The .gov means it’s official.
Local, state, and federal government websites often end in .gov. State of Georgia government websites and email systems use “georgia.gov” or “ga.gov” at the end of the address. Before sharing sensitive or personal information, make sure you’re on an official state website.
Still not sure?
Call 1-800-GEORGIA to verify that a website is an official website of the State of Georgia.
September 16, 2021
The Georgia Data Analytics Center (GDAC) site provides access to easy-to-consume data and analytics from across state government. DSGa helped the GDAC team build a site to display available data, and scale to include data they intend to add in the future.
GDAC was created by the Georgia Legislature to house the state’s data and make it publicly accessible. Many agencies have rich data regarding administrative and constituent-facing interactions that can tell a story about the agency’s success and areas of opportunity, but in many cases the data is not readily available or easy to understand . GDAC’s work gathers that data and makes it easy to find and consume. In doing so GDAC provides transparency and accountability to lawmakers, agencies, researchers, and the general public. The data is available in raw data format -- which can be downloaded by those in media, academia, or any member of the public -- but also as data visualizations that make it easier to filter and understand context and what the data means.
“Data sharing and data being in siloes has been the biggest problem for a long time, especially when there are competing priorities, policies, and statutes. We can solve this through data governance and communication,” says GDAC Director Kanti Chalasani.
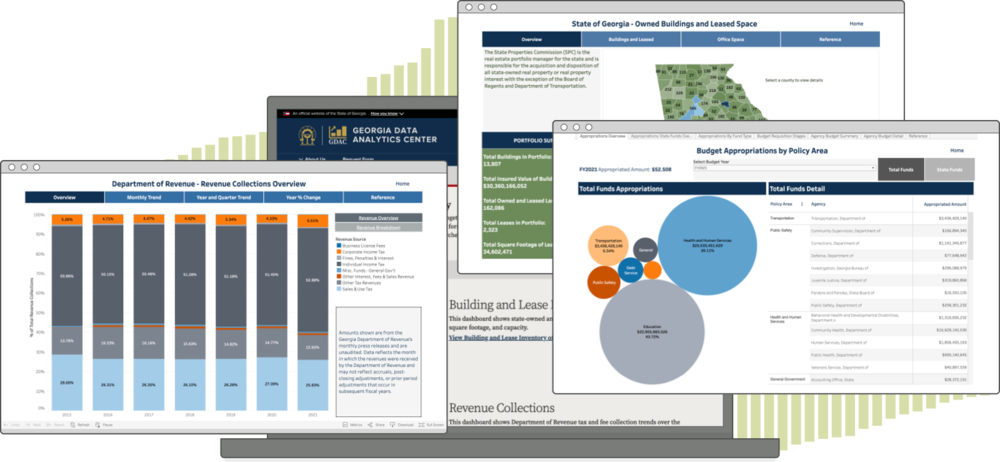
Each of the dashboards includes a help or reference page that clearly defines key terms and provides instructions on how to drill into the data of interest. For example, on the Covid Relief Funding dashboard, the help page describes how to view the data at an overview level or by organization or vendor. Once on a specific view, visitors can then drill down to review funding by specific categories.
Securing the data and building the visualizations was a huge part of GDAC’s charge. Making it easy to access is where GDAC called on DSGa for help. The GDAC team approached us with 10 data dashboards as starter content, plus a long wishlist of how they’d like the offering to grow in the future. This includes dozens of dashboards, data downloads, data governance information, data dictionaries, and more.
We drew up a plan for an initial site that is easy to navigate — bright screenshots and easy-to-read descriptions of the 10 starter dashboards. We knew, though, that as the dashboard inventory grows we’ll need to offer users an easy and logical way to find what they need. We mapped out a categorization system that can be implemented later, grouping dashboards by theme like health, education, finance, etc.
We worked with the GDAC team to be sure that once the website deployed, they would feel comfortable to expand it on their own, without needing to rely on DSGa when they were ready to grow. We gave the team a training session and a one-sheeter for easy reference when they’re ready to add more content and features to the site.
In addition to the data dashboard categorization, the GDAC team looks forward to adding direct links to data downloads, as well as online forms for users to request data analysis or raw data reports. We’re looking forward to watching the site expand as the GDAC team continues their important job of making the state’s data accessible to all.